
I’ve said it before, but it bears repeating — the ONS’s productivity data simply doesn’t make sense. According to its latest figures, UK manufacturers are hiring more people to produce less, and the labour market is supposedly booming while productivity stagnates. None of this aligns with reality. The data is broken, yet it remains the foundation for critical economic forecasts and policy decisions.
You may now be thinking that the subject of UK productivity and its mismeasurement is a subject that I just can’t leave alone, and you would be right (I also spoke about it on the W4.0 podcast last week which you can watch below).
Partly this is because it’s so important for all the reasons I have been droning on about, and also because so many financial journalists and economic commentators just accept that what the ONS tells them about productivity must be right, even though they know that the UK’s statistics authority is in the midst of a crisis in which so many of its data series have been revealed to be inaccurate and unreliable.
I think that the ONS’s productivity measurements will, sooner or later, be revealed as being in this growing group of survey-based data series that cannot be relied upon, and I thought this note might be a good excuse to highlight why.
I thought that the best way to make this point was to list in a logical order the reasons why I think this fundamentally important gauge of the UK Economy’s health is flawed.
Measuring UK GDP
In a number of blogs over the last year and a half, I’ve highlighted the problems the ONS has encountered in measuring UK GDP by reference to output measures. The example I used (in Data vs Common Sense: Fight) was the ONS’s data on UK manufacturing employment and output from Q4 2020 to Q4 2024. The most important chart (shown below) shows what the ONS thinks happened over this four-year period. In summary, according to the ONS, output fell by just over 12% but manufacturing employment rose by over 1%.

In other words, according to the ONS, the UK manufacturing industry employed 1% more people over this four-year period to produce 12% less output. As I have repeatedly said, you do not have to be an economist or a company analyst to know this has to be wrong. No business I have ever encountered would behave like this, especially in an internationally ultra-competitive sector, which the manufacturing industry typically is. Much more likely is that this nonsense is the manifestation of a measurement problem and most likely of both employment and output.
Labour Market Data
Last week’s ONS labour market data update, amongst the blizzard of numbers, is another excellent example of what I think is going wrong with the data. According to the ONS’s Labour Force Survey (LFS), employment over the last twelve months to the end of Q2 has increased by 632,000, or by very close to 2% (there are approximately 34 million people in work in the UK).
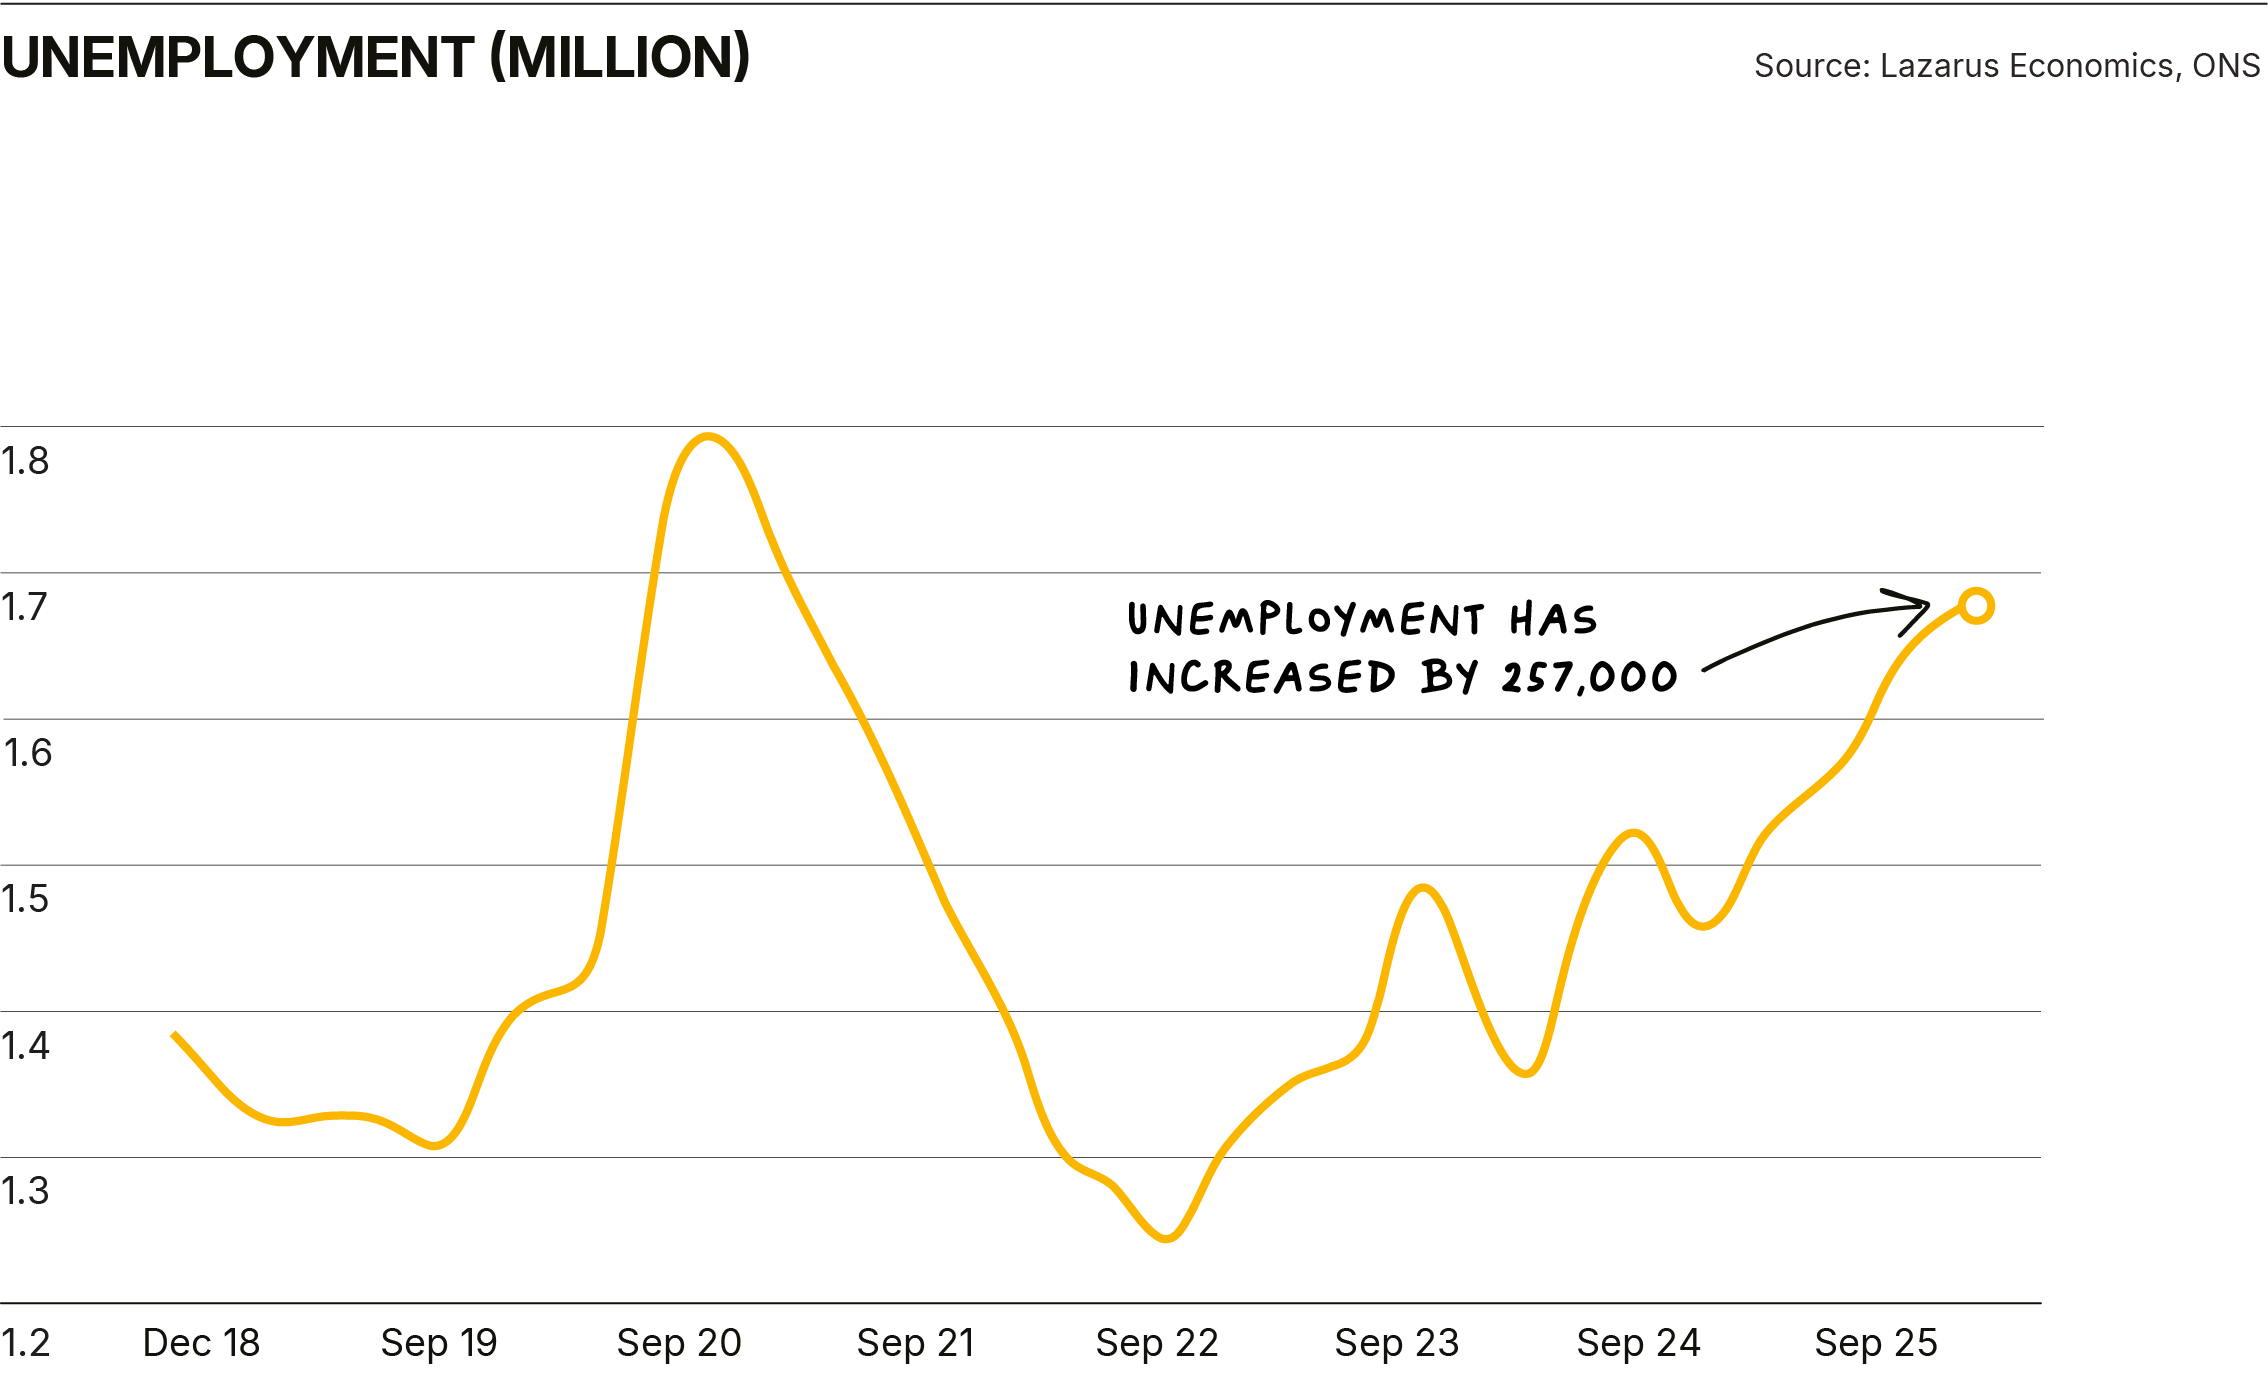
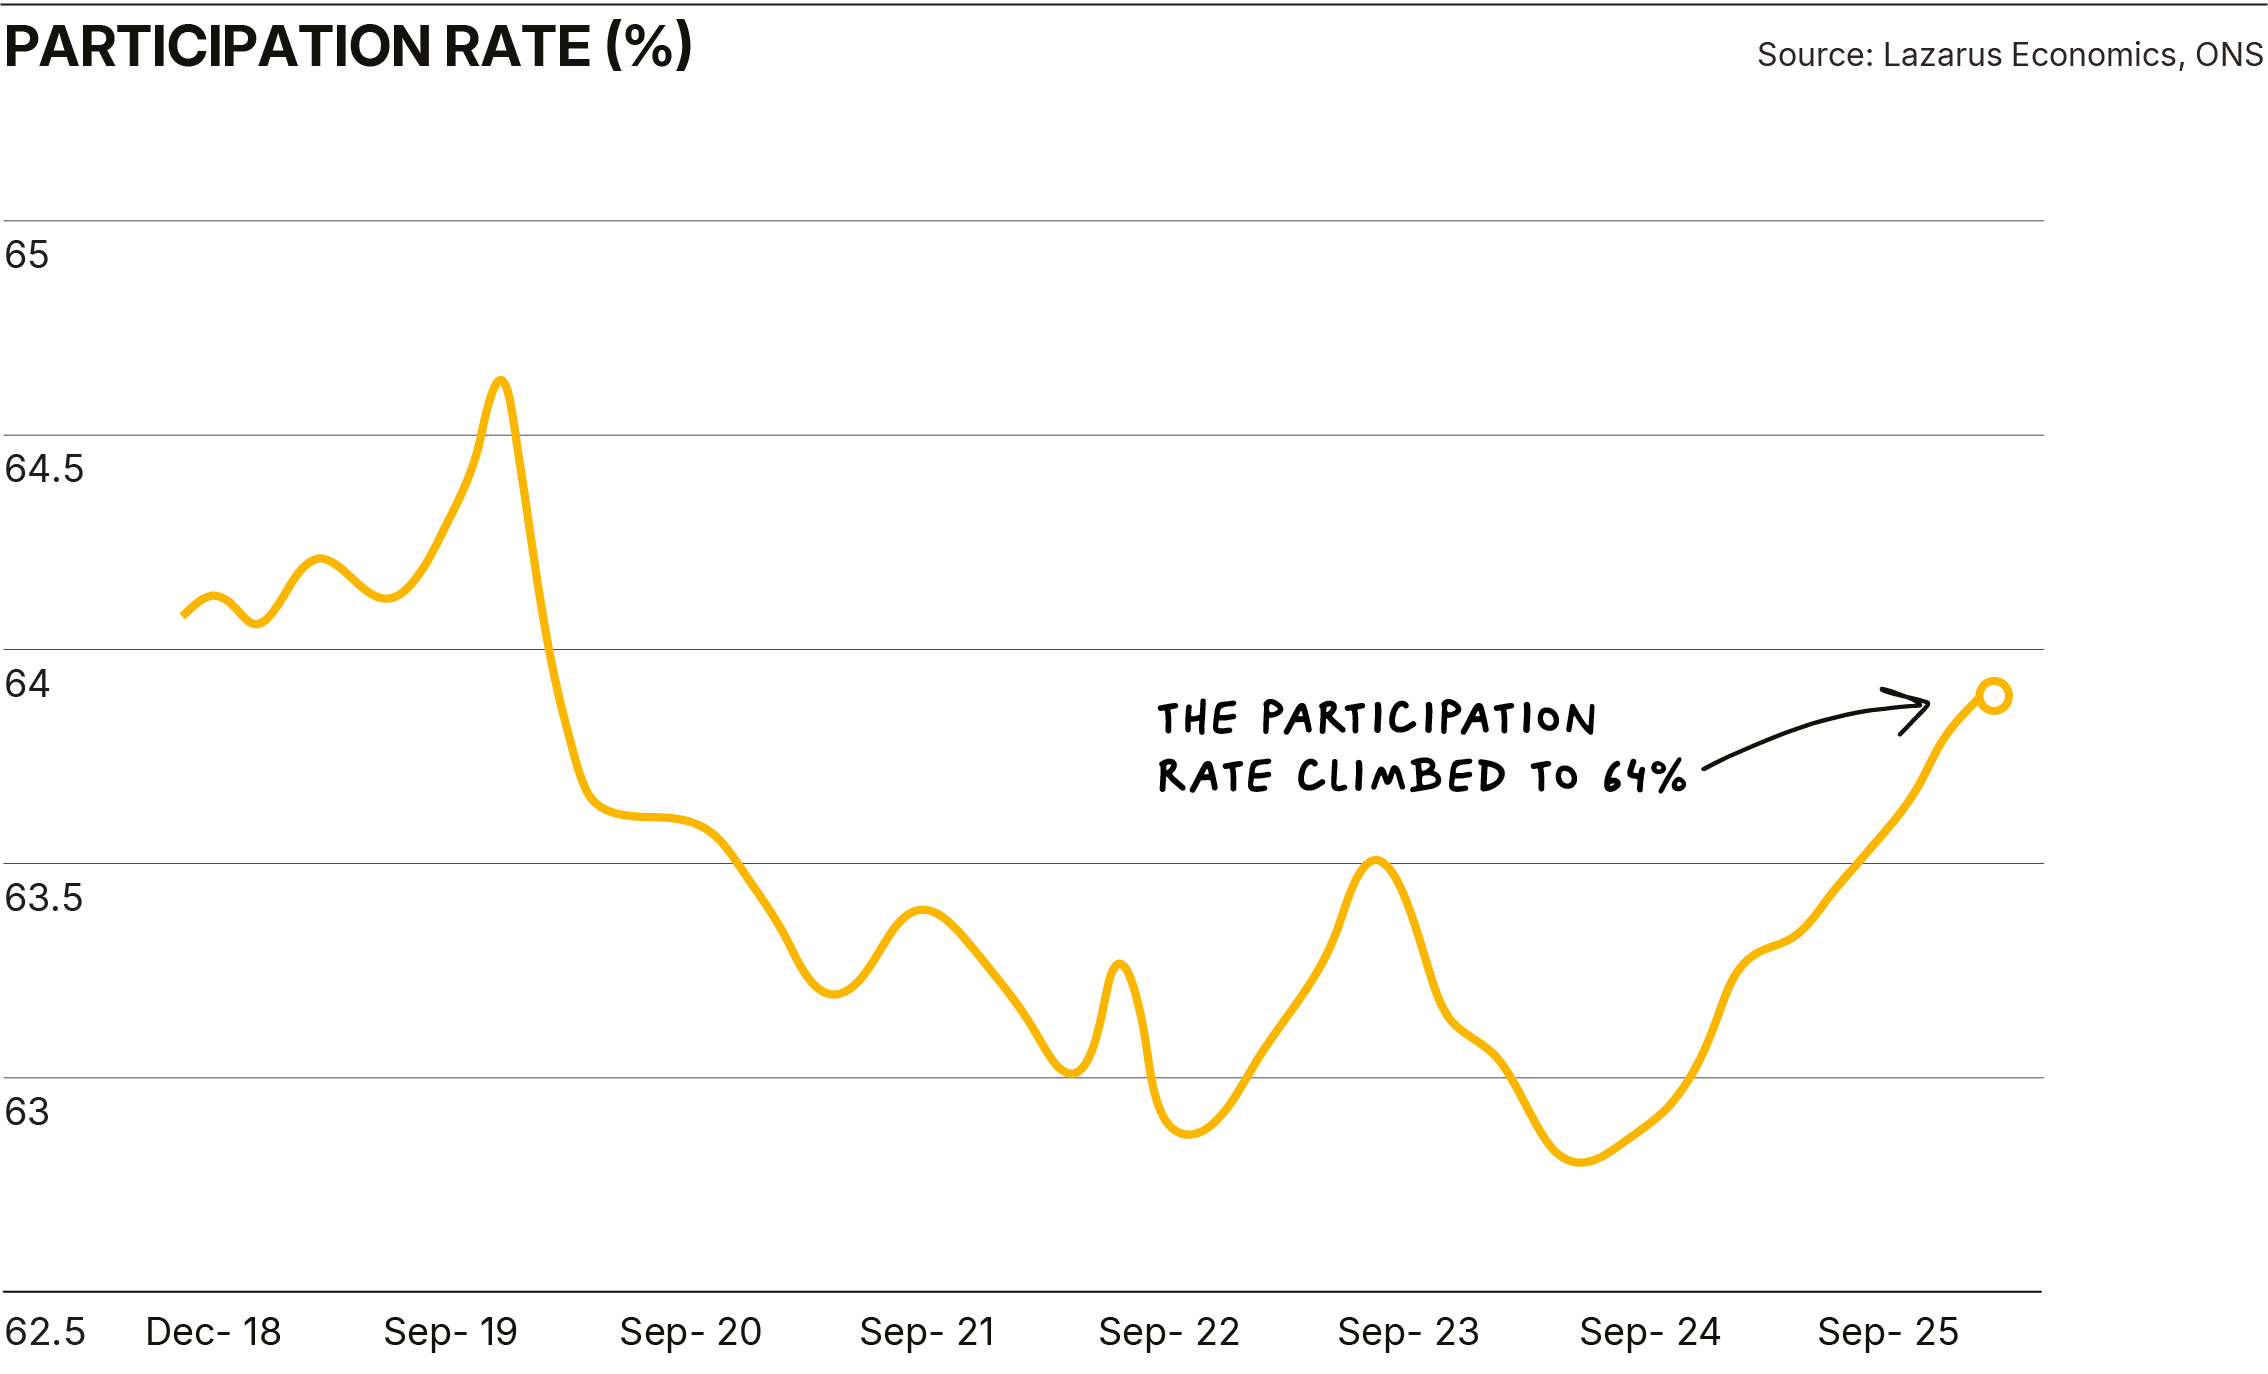
Over the same period, according to its recently revised GDP data, output has increased by 1.4%. So, in summary, according to the ONS, UK businesses (and the public sector) have employed 2% more people to grow output by 1.4% over the twelve months to the end of Q2 2025. At the same time, according to the ONS, unemployment has increased by 257,000. Which therefore means that, according to the ONS, just under 900,000 people have joined the workforce over that same period, resulting in the participation rate climbing to 64%.

Another way to show what these data imply is to represent all this in the context of the employment rate (the percentage of the working-age population, aged 16-64, that is in paid employment), as shown below.
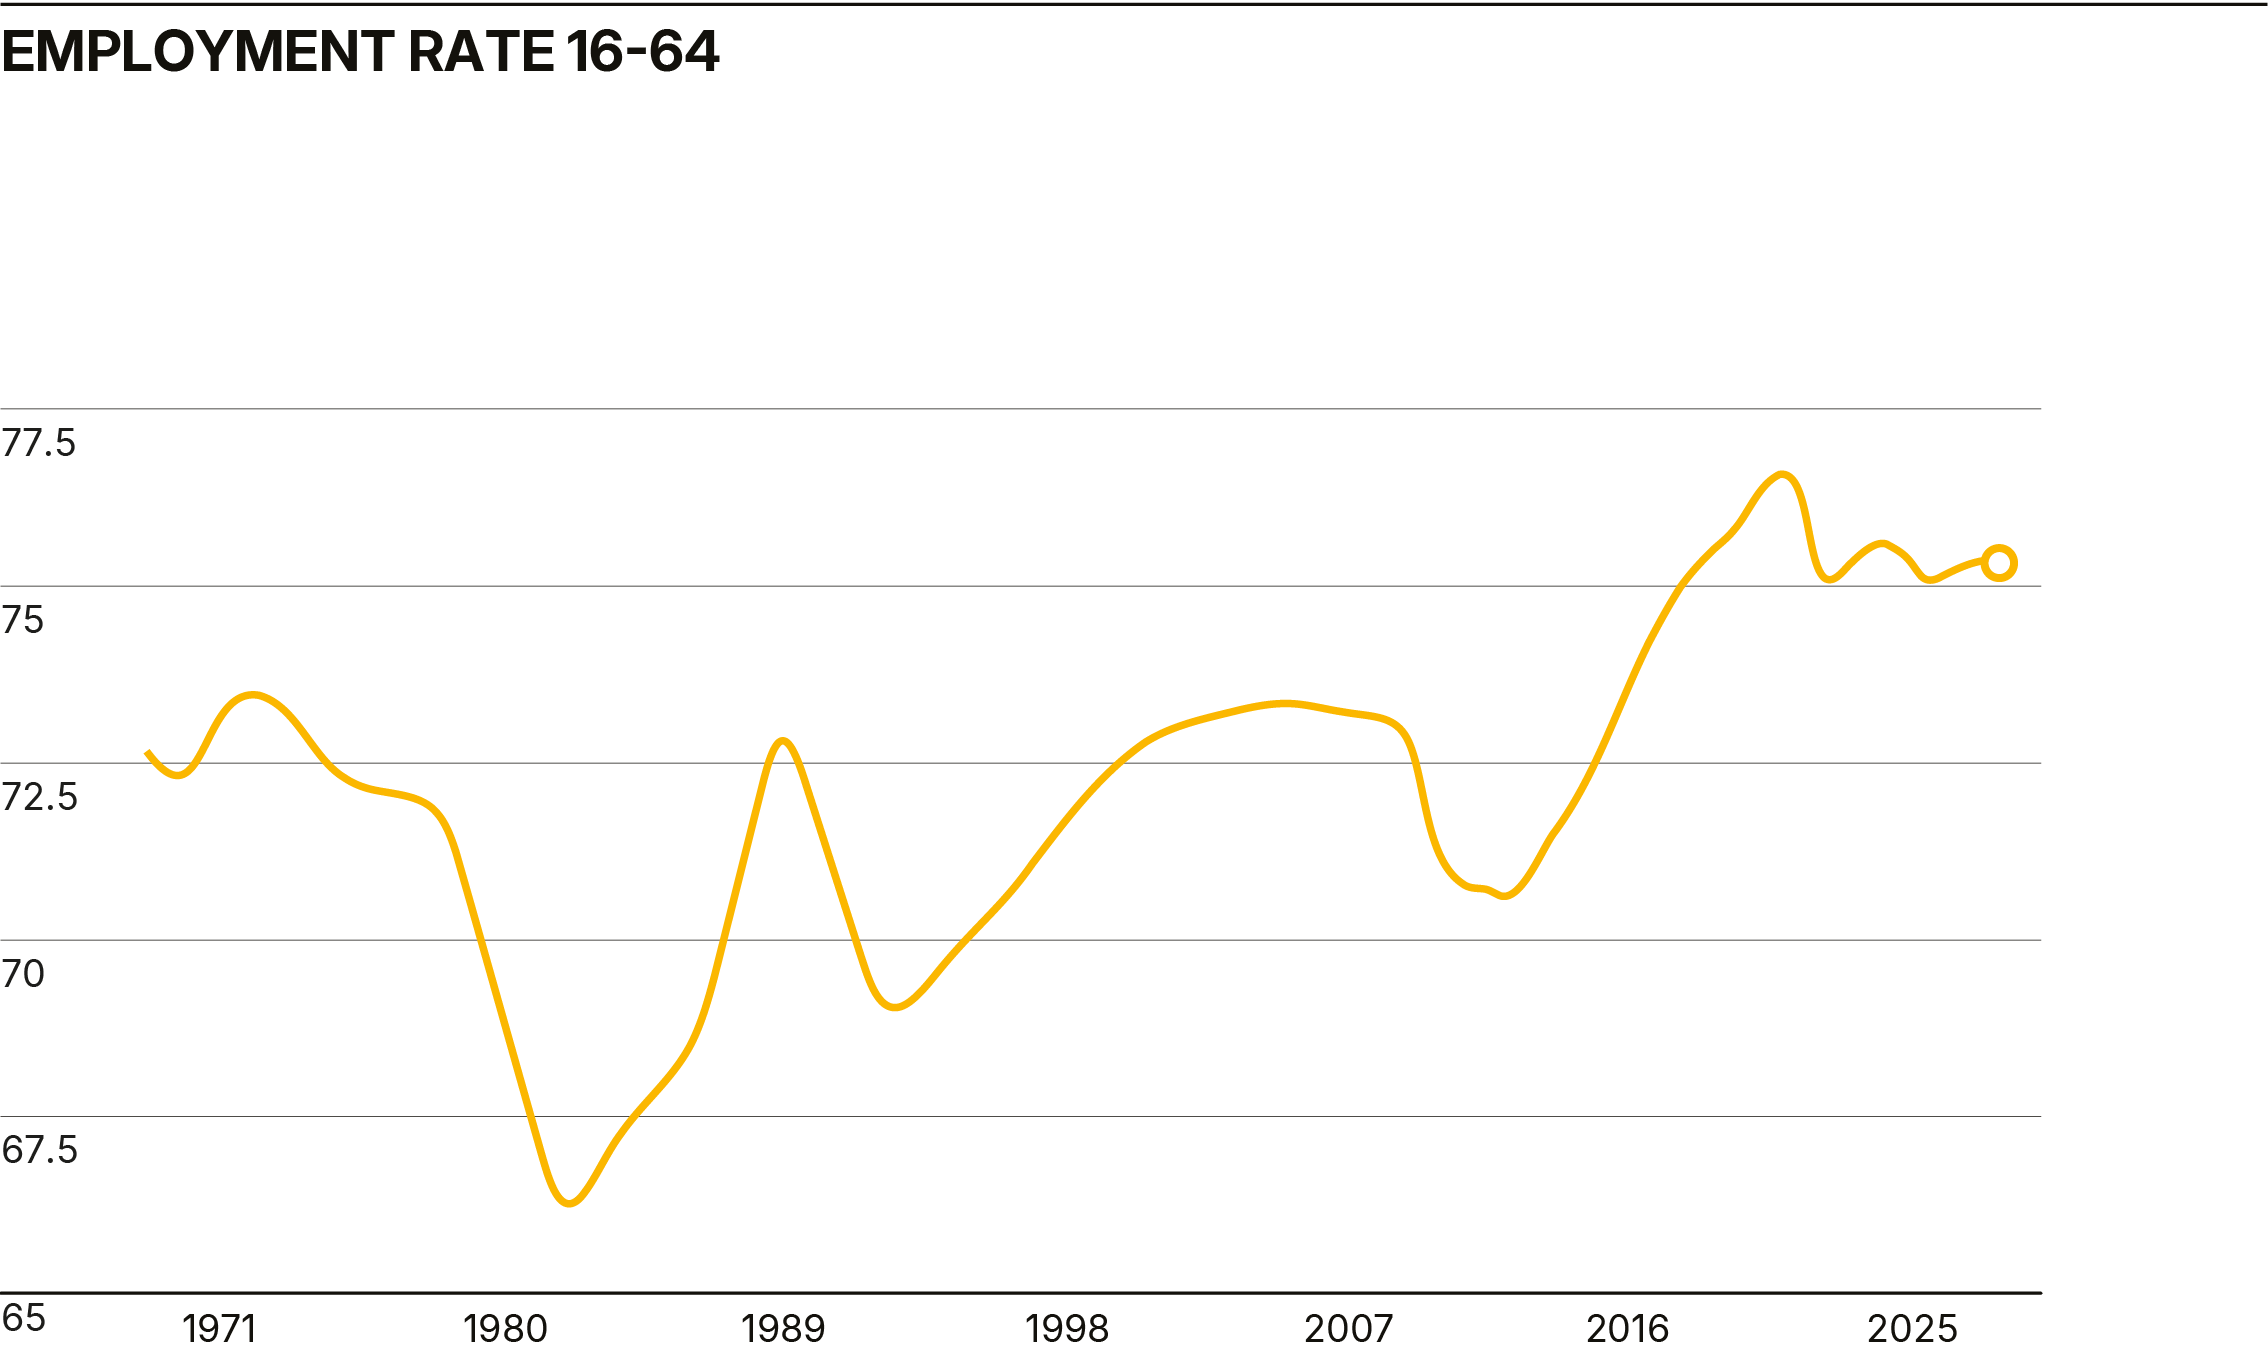
For completeness, the ONS says that unemployment is at 4.8% and the economic inactivity rate is 21%.
So, to summarise, according to the ONS, the employment rate in the UK is now just over 1% below the 55-year peak reached a couple of years ago and is now 2% higher than the highest employment rate achieved in the 46 years from 1970 through to 2016. Is this credible? Not in my world.
Surely a peak employment rate would be associated with a booming economy. I know I am much more optimistic than consensus, but even I would say that the UK economy was far from booming. I also find it hard to reconcile this data with the huge increase in the student population over the last 30 years and the more recent significant increase in long-term sickness.

Very significantly, the ONS itself seems to agree that the LFS data on which these calculations depend is flawed. In an extraordinary admission this week in the labour market data release, the ONS frequently references the unreliability of the LFS data. For example:
“An increased volatility will remain in the LFS estimates for mid-2023 and throughout 2024, so we would advise additional caution when interpreting survey change measures.”
In another section, the ONS draws attention to the different measures of employment which it collates. The LFS is one, and this is the series used for productivity calculations and the one that the OBR uses. The ONS also looks at workforce jobs (WFJ) data which is based on a business survey (the LFS is based on a household survey) and covers employee jobs (the LFS also includes estimates of self-employment) and the HMRC PAYE Real Time Indicators data. (RTI data is derived from tax records, but also only covers payrolled employees)
Interestingly, the ONS says the RTI gives “a more reliable read on employees” and has shown a fall in nine of the last twelve months. In contrast, the LFS survey, as the chart below shows, has shown consistent increases over this same period. (Pale blue line)
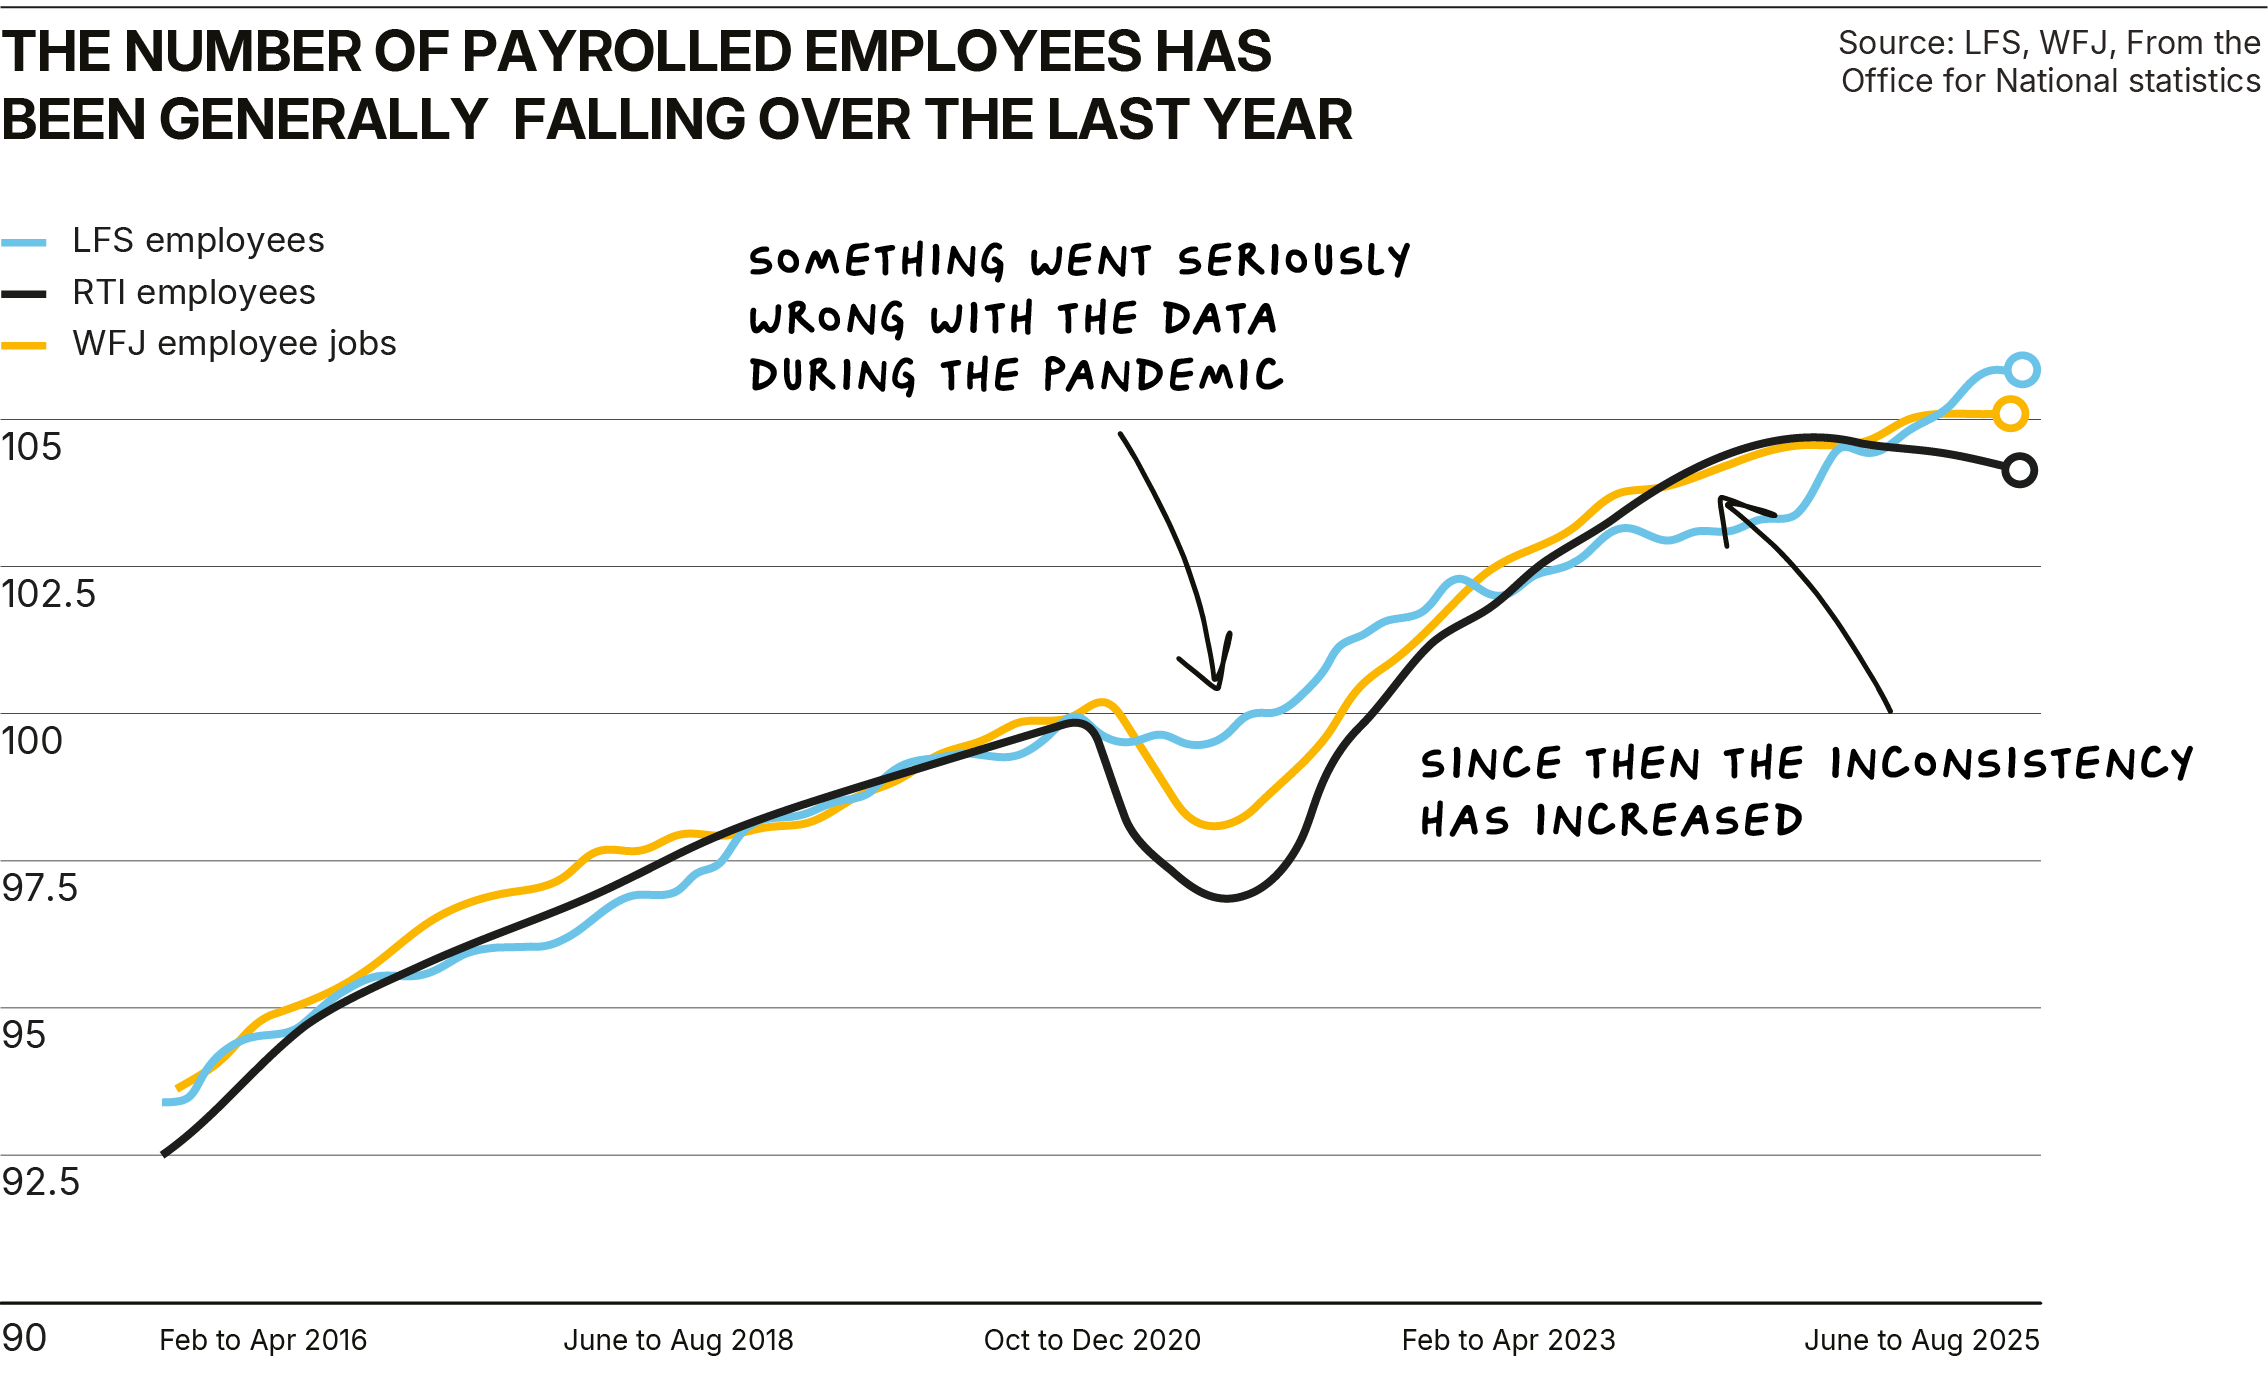
Looking at this chart (of payrolled employees), it looks like something went seriously wrong with the data during the pandemic and that since then, inconsistency has increased. Indeed, the dispersion between these series has increased in recent months.
In a further section in last week’s release, which is focused on the LFS itself, the ONS concludes with the following extraordinary admission:
“LFS estimates are currently not considered accredited official statistics and are designated as official statistics in development.”
And yet these are the crucial data on which the OBR’s “uneducated educated” productivity forecasts are based, and consensus economic commentators blithely state that the Chancellor’s tax decisions in November’s budget should also be based. This is the definition of absurd. No responsible, well-run business would behave like this, no appropriate personal financial judgements would be based on this logic, but bizarrely, apparently, something as profoundly important as the UK’s tax policy should be. There is a better way, and I hope and expect that the Chancellor will have the common sense and bravery not to succumb to this nonsense later in November.